Unit Economics in Times of Uncertainty: How Startups Can Adapt to Volatile Markets
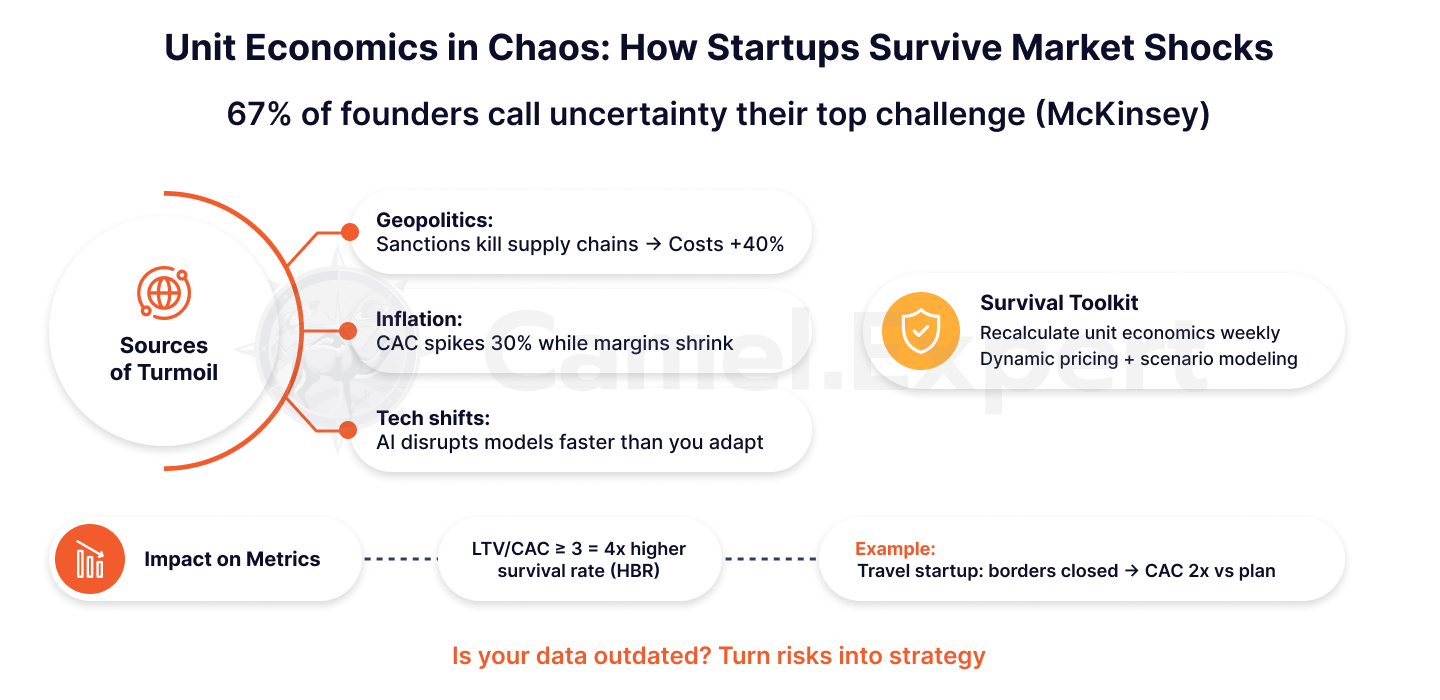
The last five years in the business world have felt like a rollercoaster: pandemics, hyperinflation, geopolitical conflicts, and supply chains snapping like thin threads. While startups once had years to test hypotheses, markets now shift faster than customers can grow. According to McKinsey, 67% of startup founders consider uncertainty the biggest challenge of 2023–2024. But how can businesses survive this turbulence? The answer lies in unit economics—a tool that turns chaos into manageable numbers, especially when combined with financial modeling for startups, which allows founders to simulate scenarios and make data-driven decisions in volatile conditions.
Why Has Instability Become the New Normal?
Imagine a travel startup facing border closures due to a pandemic just a month before launch. Or a SaaS project whose server costs surge by 40% due to currency devaluation. Today, the key sources of uncertainty are:
- Geopolitics: Sanctions, trade wars, broken supply routes.
- Inflation: Rising costs of raw materials, rent, and salaries.
- Technological shifts: AI is changing the game faster than startups can adapt.
These aren’t just “risks”—they actively pressure key metrics like CAC (Customer Acquisition Cost), LTV (Lifetime Value), and per-transaction profitability. That’s why regular CAC analysis becomes essential: it helps founders detect when acquisition costs start to outweigh long-term value, allowing them to pivot early.
Table 1: Sources of Uncertainty and Their Impact on Unit Economics
| Factor | Business Impact | Effect on Unit Economics |
| Geopolitics | Supply disruptions, sanctions, cost hikes | Rising variable costs → Lower Contribution Margin |
| Inflation | Increased prices for materials, rent, wages | Higher CAC, shrinking margins |
| Technological shifts | Obsolete business models, new competitors | Declining LTV (if customers switch to rivals) |
Unit economics is not just an investor report, but a survival model. It answers critical questions:
- How much do you lose per customer?
- What happens if your CAC jumps 30% tomorrow?
For example, during the 2022 crisis, startups with LTV/CAC ≥ 3 survived 4x more often than those ignoring these metrics (Harvard Business Review).
When refining your startup’s unit economics, focus on:
- Recalculating unit economics amid demand spikes.
- Risk forecasting tools (dynamic pricing, scenario modeling).
- Real-world cases of startups that grew profits even in crisis.
If your business still relies on yesterday’s data—you’re already behind. It’s time to turn uncertainty into a competitive edge.
Unit Economics Basics: What Every Startup Must Know
If a startup’s finances are its engine, unit economics are its fuel and pressure sensors. Without them, you risk stalling mid-journey without understanding why. One critical metric here is contribution margin calculation — it shows how much revenue remains after variable costs to cover fixed expenses and generate profit. Let’s break down how these “sensors” work and why they’re lifesavers in times of crisis.
What Is Unit Economics?
Unit economics analyzes the profitability of a single transaction, customer, or product. Simply put, it answers: “How much money do we make (or lose) per action?” For example:
- What does it cost to acquire a customer (CAC)?
- How much profit will they generate over their lifetime (LTV)?
- Do production and marketing costs pay off?
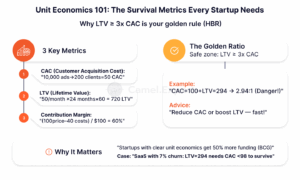
This isn’t abstract theory: Startups with transparent unit economics attract 50% more funding, even in downturns (Boston Consulting Group).
Key Metrics: CAC, LTV, Contribution Margin
1. CAC (Customer Acquisition Cost) – Cost to acquire one new customer.
Formula:
CAC = (Marketing + Sales Expenses) / Number of New Customers
What is it: Costs of acquiring one new client.
Example:
If $10,000 spent on ads brings 200 customers:
CAC = 10,000 / 200 = $50 per customer
That is, the cost of acquiring one client is $50.
2. LTV (Lifetime Value) – Total profit a customer generates.
What is it: Total profit that the client brings in over the entire period of cooperation.
Formula (SaaS example):
LTV = (Monthly ARPU × Customer Lifespan) × Profit Margin
Example:
With a $50/month subscription, 24-month lifespan, 60% margin:
LTV = (50 × 24) × 0.6 = $720 profit per customer
Thus, each client brings $720 net profit for the entire period of cooperation.
3. Contribution Margin – Profit per unit after variable costs.
What is it: Profit from one unit of a product after subtracting variable costs (e.g. raw materials, shipping, commissions).
Formula:
Contribution Margin = (Price – Variable Costs) / Price × 100%
Example:
If a product sells for $100 and variable costs are $40, then:
CM = (100 – 40) / 100 × 100% = 60%
This means that 60% of the product price remains as the contribution margin after variable costs are deducted.
How Metrics Interconnect?
Think of unit economics as a survival chain:
- CAC = Your investment in a customer.
- LTV = Their return to you.
- Contribution Margin = What remains after variable costs.
Golden Rule in Unit Economics: LTV should be ≥ 3x CAC (according to Harvard Business Review).
If CAC = $50 and LTV = $150, the business is in a safe zone. But if the ratio drops to 1:1, the business can go bankrupt in a few months.
Example: SaaS LTV Calculation
Let’s say a company offers a subscription for $30/month.
- ARPU (average revenue per user): $30
- Churn Rate (customer churn): 7% per month
- Customer lifespan: 1 / 0.07 ≈ 14 months
- Marginality: 70% (including server costs, support, taxes)
LTV calculation:
LTV = 30 × 14 × 0.7 = $294
Why is this important?
If a startup’s CAC = $100, and LTV = $294, then the ratio is 2.94:1.
This is close to the danger zone, and the business needs to:
- Reduce CAC (optimize marketing, improve conversion)
- Increase LTV (retain customers, increase their lifetime due to the value of the product)
Remember! Even a profitable model can be unstable if LTV slightly exceeds CAC.
Why is unit economics critical in times of instability?
When markets change daily, “average” metrics become meaningless. This is where unit economics saves startups:
- Rapid scenario recalculation
- Example: Due to sanctions, CAC increased by 40%. Knowing the baseline metrics, you model new conditions within an hour—cutting ad channels, adjusting prices.
- Avoiding fatal mistakes
- Case: An ecommerce startup launched a “50% off” promo without calculating Contribution Margin. Result: Each sale brought a $10 loss. Unit economics would have revealed this beforehand.
- Focusing on profitable actions
- If you know TikTok customers have an LTV of 500, while Instagram’s is 200, you reallocate the budget before a crisis hits your finances.
Table 2: How to Calculate Key Unit Economics Metrics
| Metric | Formula | What Does It Measure? |
| CAC (Customer Acquisition Cost) | (Marketing Expenses + Sales Costs) / Number of New Customers | How expensive it is to acquire customers |
| LTV (Lifetime Value) | (Average Revenue per Customer × Customer Lifespan) × Profit Margin | How much profit a customer generates over their lifetime |
| Contribution Margin | (Price – Variable Costs) / Price × 100% | What portion of revenue can be considered profit after variable costs |
How uncertainty disrupts traditional models
If unit economics is a compass, instability is a hurricane that throws it off course. Startups that seemed “stable” yesterday can find themselves in a storm of unpredictable changes overnight. Even experienced teams often make fatal mistakes — especially when they ignore saas unit economics and rely only on growth metrics without understanding profitability.
1. Typical Instability Scenarios: When Numbers Spiral Out of Control
A. Sudden Demand Shifts
Пример: В марте 2020 года стартапы в сфере туризма потеряли 80% выручки за неделю из-за локдаунов. Компания TravelTech, предлагавшая планировщики путешествий, столкнулась с падением LTV с 200 до 40 — клиенты просто перестали покупать подписки.
Почему это опасно? Фиксированные затраты (аренда офиса, зарплаты) остались прежними, а выручка испарилась. Без экстренного пересчёта юнит-экономики стартапы сгорают за месяцы.
Example: In March 2020, travel startups lost 80% of their revenue in a week due to lockdowns. TravelTech, a trip-planning startup, saw LTV drop from 200 to 40—customers simply stopped subscribing.
Why is this dangerous? Fixed costs (rent, salaries) remained the same while revenue evaporated. Without recalculating saas unit economics, startups burn out in months.
B. Rising Customer Acquisition Costs (CAC)
Example: In 2023, U.S. EdTech startups saw CAC increase by 35% (Bain & Company). The reason? Market saturation—competitors spent millions on targeted ads, driving up Facebook Ads costs. A thorough CAC analysis revealed that many startups were overspending without improving conversion rates, leading to a reevaluation of marketing strategies.
Why does this matter? If CAC rises while LTV stays flat, the LTV/CAC ratio approaches 1:1—a direct path to losses.
C. Currency Volatility & Raw Material Price Swings
Example: In 2022, a Turkish ecommerce startup faced a 100% lira devaluation. Dollar-denominated logistics costs doubled, but prices had to be frozen due to plummeting purchasing power. Contribution Margin fell from 40% to 5%, turning profits into losses.
2. Startup Mistakes: Why “Average” Metrics Kill Businesses
Mistake 1: Fixating on “Average” Values
Case: A retail startup calculated annual average CAC (50). But in December,holiday competition spiked CAC to 120. Instead of reallocating budgets, they kept spending aggressively, losing $70 per customer.
Why does it happen?
- Average metrics hide extreme scenarios.
- Without analyzing percentiles (e.g., “CAC in the worst 10% of days”), startups are unprepared for crises.
Mistake 2: Ignoring Variable Costs
Example: A FoodTech company ran a “$1 delivery” promo without accounting for the actual $5 delivery cost. With a -400% Contribution Margin, each order deepened debt.
Solution: Even in a crisis, always calculate minimum per-unit profit before promotions.
Mistake 3: “We’ll Fix It Later”
Why is this fatal? In 2024, 60% of startups that postponed recalculating unit economics until “after the crisis” went bankrupt (Startup Genome). Uncertainty doesn’t give second chances.
Adaptation Strategies: How to Restructure Unit Economics
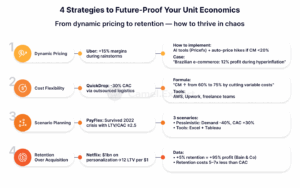
When uncertainty storms wipe out traditional business models, survival depends not on hope but on rewriting the rules fast. Here are four strategies to turn your saas unit economics into an “unsinkable platform.”
1. Dynamic Pricing: How Uber Survives Peak Hours
What it is: Real-time price adjustments based on demand, competition, and external factors.
Example: Uber’s algorithms raise prices during rain or rush hour. In 2023, this boosted margins by 15% despite rising fuel costs (Statista).
How to implement:
- Use AI tools (e.g., ProsperWorks, Pricefx) for live data analysis.
- Link pricing to unit economics:
- If Contribution Margin drops below 20%, auto-increase prices.
- Offer discounts only if CM stays positive.
Case: A Brazilian ecommerce startup used dynamic pricing during 2022 hyperinflation. The algorithm tracked dollar rates and costs, maintaining 12% profitability despite the crisis.
2. Cost Flexibility: From Fixed Expenses to “Cloud-Based” Operations
Why it matters: Fixed costs (rent, salaries) become an anchor when revenue drops.
Example: Delivery startup QuickDrop reduced CAC by 30% by outsourcing logistics. Instead of maintaining its own fleet, it partnered with local couriers, paying only per completed delivery.
How to implement:
- Replace fixed costs with variable ones:
- Outsourced development (e.g., freelancers on Upwork).
- Cloud servers (AWS, Google Cloud) instead of buying hardware.
- Recalculate Contribution Margin:
If previously the contribution margin (CM) was calculated using the formula: CM = (Price – Variable Costs) / Price × 100%, then when switching to outsourcing, variable costs are reduced to $25, and CM increases.
Calculation example:
Initial data:
Product price = $100
Previously: Variable costs = $40
CM = (100 – 40) / 100 × 100% = 60%
After cost reduction: Variable costs = $25
CM = (100 – 25) / 100 × 100% = 75%
Thus, CM will increase from 60% to 75%, which will significantly increase the profitability of the business.
3. Scenario Planning: Three Futures to Prepare For
“Average” metrics are useless when markets swing by ±50%.
How it works:
- Optimistic scenario: Demand grows by 20%, CAC drops by 10%.
- Baseline scenario: Demand stays flat, CAC rises by 5%.
- Pessimistic scenario: Demand falls by 40%, CAC spikes by 30%.
Case study: FinTech company PayFlex pre-calculated CM for all three scenarios before the 2022 crisis. When CAC surged by 25%, they instantly cut unprofitable ad channels, maintaining LTV/CAC ≥ 2.5.
Instruments:
- Excel templates with dynamic formulas.
- Predictive analytics in Tableau for risk visualization.
4. Retention: Why Netflix Spends $1B on Personalization
Why retention is more important than acquisition:
- A 5% increase in retention boosts profits by 25–95% (Bain & Company).
- Retaining a customer costs 5–7x less than acquiring a new one (Harvard Business Review).
For example Netflix:
- AI-driven content recommendations reduced churn from 4.5% to 2.8% in 3 years.
- Every dollar invested into personalization increased LTV by $12.
How to implement:
- Segment customers by LTV: Focus on the top 20% driving 80% of profit.
- Loyalty programs: Discounts for repeat purchases, exclusive content.
Tools & Technologies for Data-Driven Unit Economics
If unit economics is the engine of a startup, then data is its fuel. But without the right tools, you risk drowning in a pile of numbers. Let’s look at which technologies will turn your metrics analysis from routine into a competitive advantage.
1. Analytics Platforms: Visualizing CAC & LTV
You need tools for data collection, analysis, and real-time data visualization.
Examples:
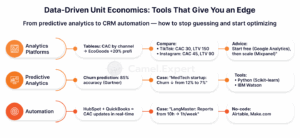
- Tableau: Builds dashboards that show how CAC changes across regions or channels.
- Google Analytics 4: Tracks customer behavior on websites, helping understand which actions increase LTV.
- Power BI: Automatically updates Contribution Margin when prices or costs change.
Case: Startup EcoGoods used Tableau to analyze the effectiveness of advertising channels. The findings revealed:
- Customers from TikTok: CAC = $30, LTV = $150
- Customer from Instagram: CAC = $45, LTV = $90
The company reallocated its advertising budget to TikTok, increasing profitability by 20%.
Start with free tools (like Google Analytics), then transition to paid solutions – for example, Mixpanel for cohort analysis.
2. Predictive Analytics: How to Forecast Customer Churn Tomorrow
This is where machine learning (ML) and AI are most appropriate to model future scenarios.
Examples:
- LTV Prediction: Algorithms analyze historical data (purchase frequency, average order value) to predict how much a customer will generate in a year.
- Churn Rate: Models identify “at-risk groups” – customers likely to churn within the next 30 days (85% accuracy, Gartner data).
Tools:
- Python libraries: Scikit-learn for building ML models
- Ready-made solutions: IBM Watson, Salesforce Einstein
Case: A MedTech subscription startup implemented a churn prediction model. The system flagged customers with declining activity and automatically sent them personalized discounts. Churn Rate decreased from 12% to 7% within a quarter.
3. Automation: When Your CRM Calculates Unit Economics Itself
Integrate CRM (customer management) with financial systems to synchronize data.
Examples:
- HubSpot + QuickBooks: Automatically transfers CAC from ad platforms to reports
- Zapier: Links sales data to Contribution Margin calculations in Google Sheets
Case: EdTech startup LangMaster connected its CRM (HubSpot) to analytics platform (Looker). Now:
- Customer data (payment history, activity) updates in real-time
- Unit economics recalculates automatically when subscription prices change
- Report preparation time decreased from 10 hours to 1 hour per week.
Use no-code tools (Airtable, Make.com) if development resources are limited.
Table 3: Unit Economics Analysis Tools
| Tool | Functionality | Cost | Use Case Example |
| Tableau | CAC/LTV dashboards, visualization | From $70/month | Analyzing channel profitability |
| Google Analytics | Customer behavior tracking | Free | Measuring conversion & churn |
| Power BI | Automated reports, Excel integration | From $10/month | Monitoring Contribution Margin |
| HubSpot + QuickBooks | CAC & finance automation | From $45/month | Syncing sales data with financial metrics |
Real Cases: Survival Lessons
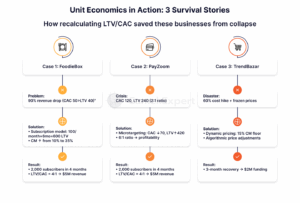
When theory meets reality, only those who act quickly and flexibly survive. These three stories show how recalculating unit economics saved businesses when others gave up.
Case 1: The HoReCa Startup That Fed Its Subscribers
Problem:
In March 2020, restaurant chain FoodieBox lost 90% of its revenue due to lockdowns. Their traditional dine-in model became unprofitable:
- CAC = $50
- LTV = $40
Solution:
Switched to a subscription model (“Dinners at Home”)—customers paid $100/month for 4 ready-made meal kits.
LTV Recalculation:
- Average subscription duration: 6 months
- LTV = 100 × 6 = $600
Cost Optimization::
- Bulk purchasing reduced meal kit costs by 30%
- Contribution Margin increased from 10% to 35%
Result:
Within 4 months, the startup gained 2,000 subscribers, achieving an LTV/CAC ratio of 4:1.
Today, FoodieBox is a national franchise with $5M in revenue.
Quote from the CEO: “We realized we couldn’t cling to the old model. Recalculating unit economics took two weeks—it saved the business.”
Case 2: The FinTech That Found “Golden” Customers Through Microtargeting
Problem:
In 2022, FinTech startup PayZoom was spending
$120 on acquiring a customer (CAC) ,while LTV was $240. When the market crashed, venture funding froze.
Solution
Microtargeting on social media:
- Shifted focus from broad audiences to small businesses with $500k+ annual revenue.
Data analysis:
- CAC for this group dropped to $70 (vs $120 average)
- LTV increased to $420 due to cross-sales (insurance, loans).
Result:
The LTV/CAC ratio improved from 2:1 to 6:1. The startup became profitable without additional investments.
Lesson: “Not all customers are equally valuable. Unit economics helped find those who bring 80% of the profit.”
Case 3: The Ecommerce That Danced on Currency Swings
Problem:
In 2023, Turkish marketplace TrendBazar was on the verge of bankruptcy:
Lira devaluation increased product costs by 60%
Prices had to be frozen due to plummeting demand
Solution:
- Dynamic pricing: An algorithm recalculated prices daily based on dollar exchange rates and competitor pricing.
- Focus on Contribution Margin:
- Minimum margin set at 15%
- If costs rose, prices increased automatically—even if it reduced sales volume.
Result:
Profitability recovered within 3 months. In 2024, the startup secured $2M in investments.
CFO Comment: “We used to think price = demand. Now we know: price = survival.”
What Connects These Cases?
- Speed: Recalculating unit economics took days, not months.
- Metric focus: Decisions were driven by CAC, LTV, Contribution Margin—not emotions.
- Flexibility: Willingness to abandon “traditional” models for profitability.
These stories aren’t exceptions—they’re proof: uncertainty can be turned into an advantage.
Unit economics is not an Excel spreadsheet that can be created once and forgotten. It is a living organism that must evolve along with the market. As the HoReCa, FinTech and ecommerce cases have shown, those who recalculated CAC, LTV and Contribution Margin in time not only survived, but also found new growth points. But in conditions where tomorrow’s exchange rate or demand is unpredictable, even these solutions become obsolete within months.
Why revisit unit economics every 90 days?
- Markets change faster than you think:
- CAC can spike 30% due to new competitors.
- LTV can halve from declining loyalty (as seen during the pandemic).
- Crises expose weaknesses:
- Relying on “average” metrics (like the FoodTech case) leads to disaster.
- Technology evolves:
- Predictive analytics and automation tools require regular data updates.
According to BCG, startups reviewing unit economics quarterly are 2.5x more likely to achieve profitability during volatility.
Paradoxically, instability is your ally—if you are will to adapt
Turbulence divides the market into those who cling to the past and those who use chaos as a springboard. Your next step is to turn threats into opportunities:
- Implement scenario planning to preempt risks.
- Automate calculations, like EdTech LangMaster.
- Focus on high-LTV clients, not mass acquisition.
If your current model ignores 2024’s market volatility—you’re already losing money. The Camel Expert team will help with:
- Recalibrate unit economics for new realities.
- Deploy dynamic pricing and predictive analytics.
- Unlock hidden profit reserves—even in a crisis.
Book a 30-minute consultation to turn uncertainty into your greatest asset.
Appendix
Checklist: 12 Steps to Adapt Unit Economics During Uncertainty
(A practical guide for startup founders and managers)
1. Diagnose Your Current Model
- Step 1. Recalculate core metrics (CAC, LTV, Contribution Margin):
- CAC, LTV, Contribution Margin — make sure the formulas are up to date (see Table 2 in the article).
- Key metric: Is LTV/CAC ≥ 3? If not, optimize immediately.
- Step 2: Identify weak points:
- Analyze which factors (inflation, geopolitics) have the greatest impact on your metrics (see Table 1).
- Example: If Contribution Margin has fallen below 20%, as in the Turkish ecommerce case, implement dynamic pricing.
2. Adapt to External Risks
- Step 3. Model Three Scenarios:
- Optimistic, baseline, pessimistic (like FinTech PayFlex).
- Calculate CAC and LTV for each (use templates in Excel or Tableau).
- Step 4. Implement dynamic pricing:
- Set up algorithms (like Pricefx) to automatically adjust prices for demand and expenses.
- Case: A Brazilian marketplace maintained 12% margins during hyperinflation.
- Step 5. Shift to variable costs:
- Replace fixed costs (rent, staff) with outsourcing and cloud solutions (like QuickDrop).
- Formula: CM = (Price – New variable costs) / Price × 100%.
3. Optimize the customer cycle
- Step 6. Segment customers by LTV:
- Focus on the “top 20%” that generate 80% of profit (like Netflix).
- Instruments: Google Analytics + RFM-analysis.
- Step 7. Reduce CAC through microtargeting:
- Identify narrow niches (example: small business with $500k+ turnover $500k+ for FinTech).
- Result: PayZoom reduced CAC by 40%.
- Step 8. Increase Retention Rate:
- Launch loyalty programs: discounts for repeat purchases, personalized content.
- Rule: 5% customer retention = 25-95% profit growth (Bain & Company).
4. Build a Tech Foundation
- Step 9. Automate reports:
- Integrate your CRM (like HubSpot) with financial systems (like QuickBooks) — just like the EdTech startup LangMaster did. This integration streamlines financial modeling for startups, providing accurate data for forecasting revenue and expenses.
- Time savings: From 10 hours to 1 hour per week.
- Steps 10. Deploy predictive analytics:
- Use ML models (Python, IBM Watson) to predict customer churn.
- Example: MedTech startup reduced Churn Rate from 12% to 7%.
5. Regular audit
- Step 11. Recalculate metrics every 90 days:
- Markets change faster than you think (see data from BCG in the Conclusion).
- Meeting checklist:
- Are CAC and LTV relevant?
- How has the Contribution Margin changed?
- Which scenarios require adjustment?
- Step 12. Team training:
- Hold workshops on unit economics.
- Case study: How HoReCa FoodieBox switched to a subscription model in 2 weeks.
Using this checklist will help your startup turn uncertainty into control over key indicators and increase business sustainability.